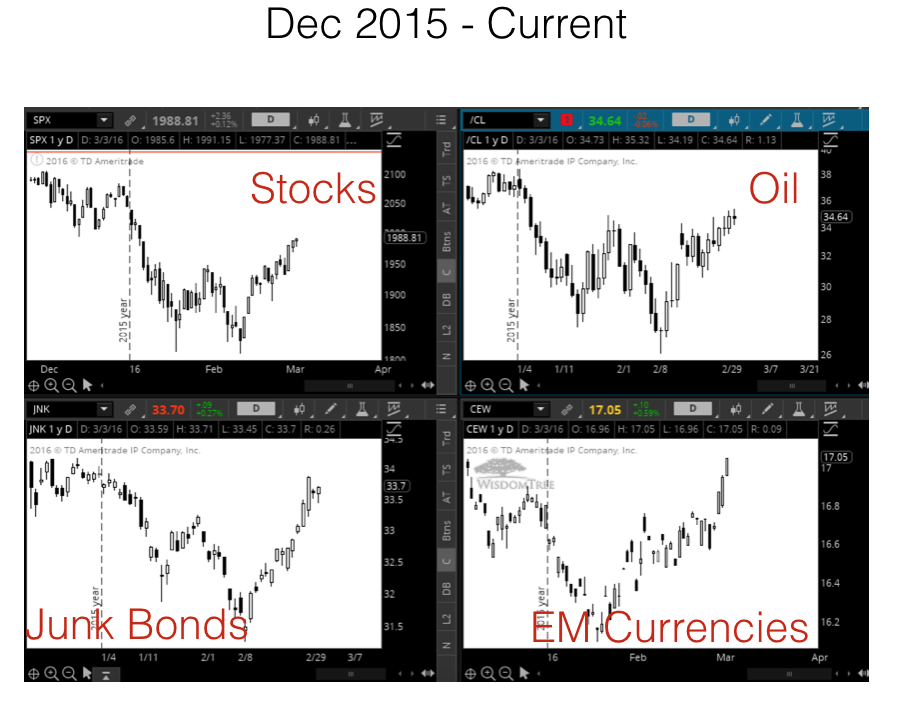
The move in the S&P 500 since January 1st (the selloff, bounce, weak test of the lows and a big surge afterwards) has been so eerily similar to the Aug-Oct move a few months back that it’s a little weird… Even the multiple 2-day retracements in the middle of the surge. The August selloff unfolded after…
Chart of the Week: Not a Good Sign for Global Stock Markets
The chart below was going around a lot last week. It shows a composition of AP Moller-Maersk (the world’s largest container shipping company) and Sotheby’s (the auction house of high-end art, etc.) in blue vs. the MSCI World Stock Index in orange. That’s a pretty tight correlation and a pretty wide gap we’re seeing right…
